

Finding less crowded trains in Tokyo just got easier. On Tuesday, Tokyo Metro Co., Ltd. launched Metro CrowdNavi, a website that lets passengers check congestion levels across all of its rail lines. The service provides average crowding data from the previous five days by station, time and train service, while a heatmap shows congestion levels across an entire route at a glance. It is available in Japanese and English and does not require registration.
A trial version of the website launched in March, initially covering three of Tokyo Metro’s most congested routes: the Hibiya, Tozai and Chiyoda lines. Following a successful testing phase, the service expanded to include the network’s remaining six lines — Ginza, Marunouchi, Yurakucho, Hanzomon, Namboku and Fukutoshin. Selecting a line brings up a color-coded graph displaying congestion levels using six categories. The scale ranges from light blue, indicating seats are available, to purple, which signifies extremely crowded conditions.
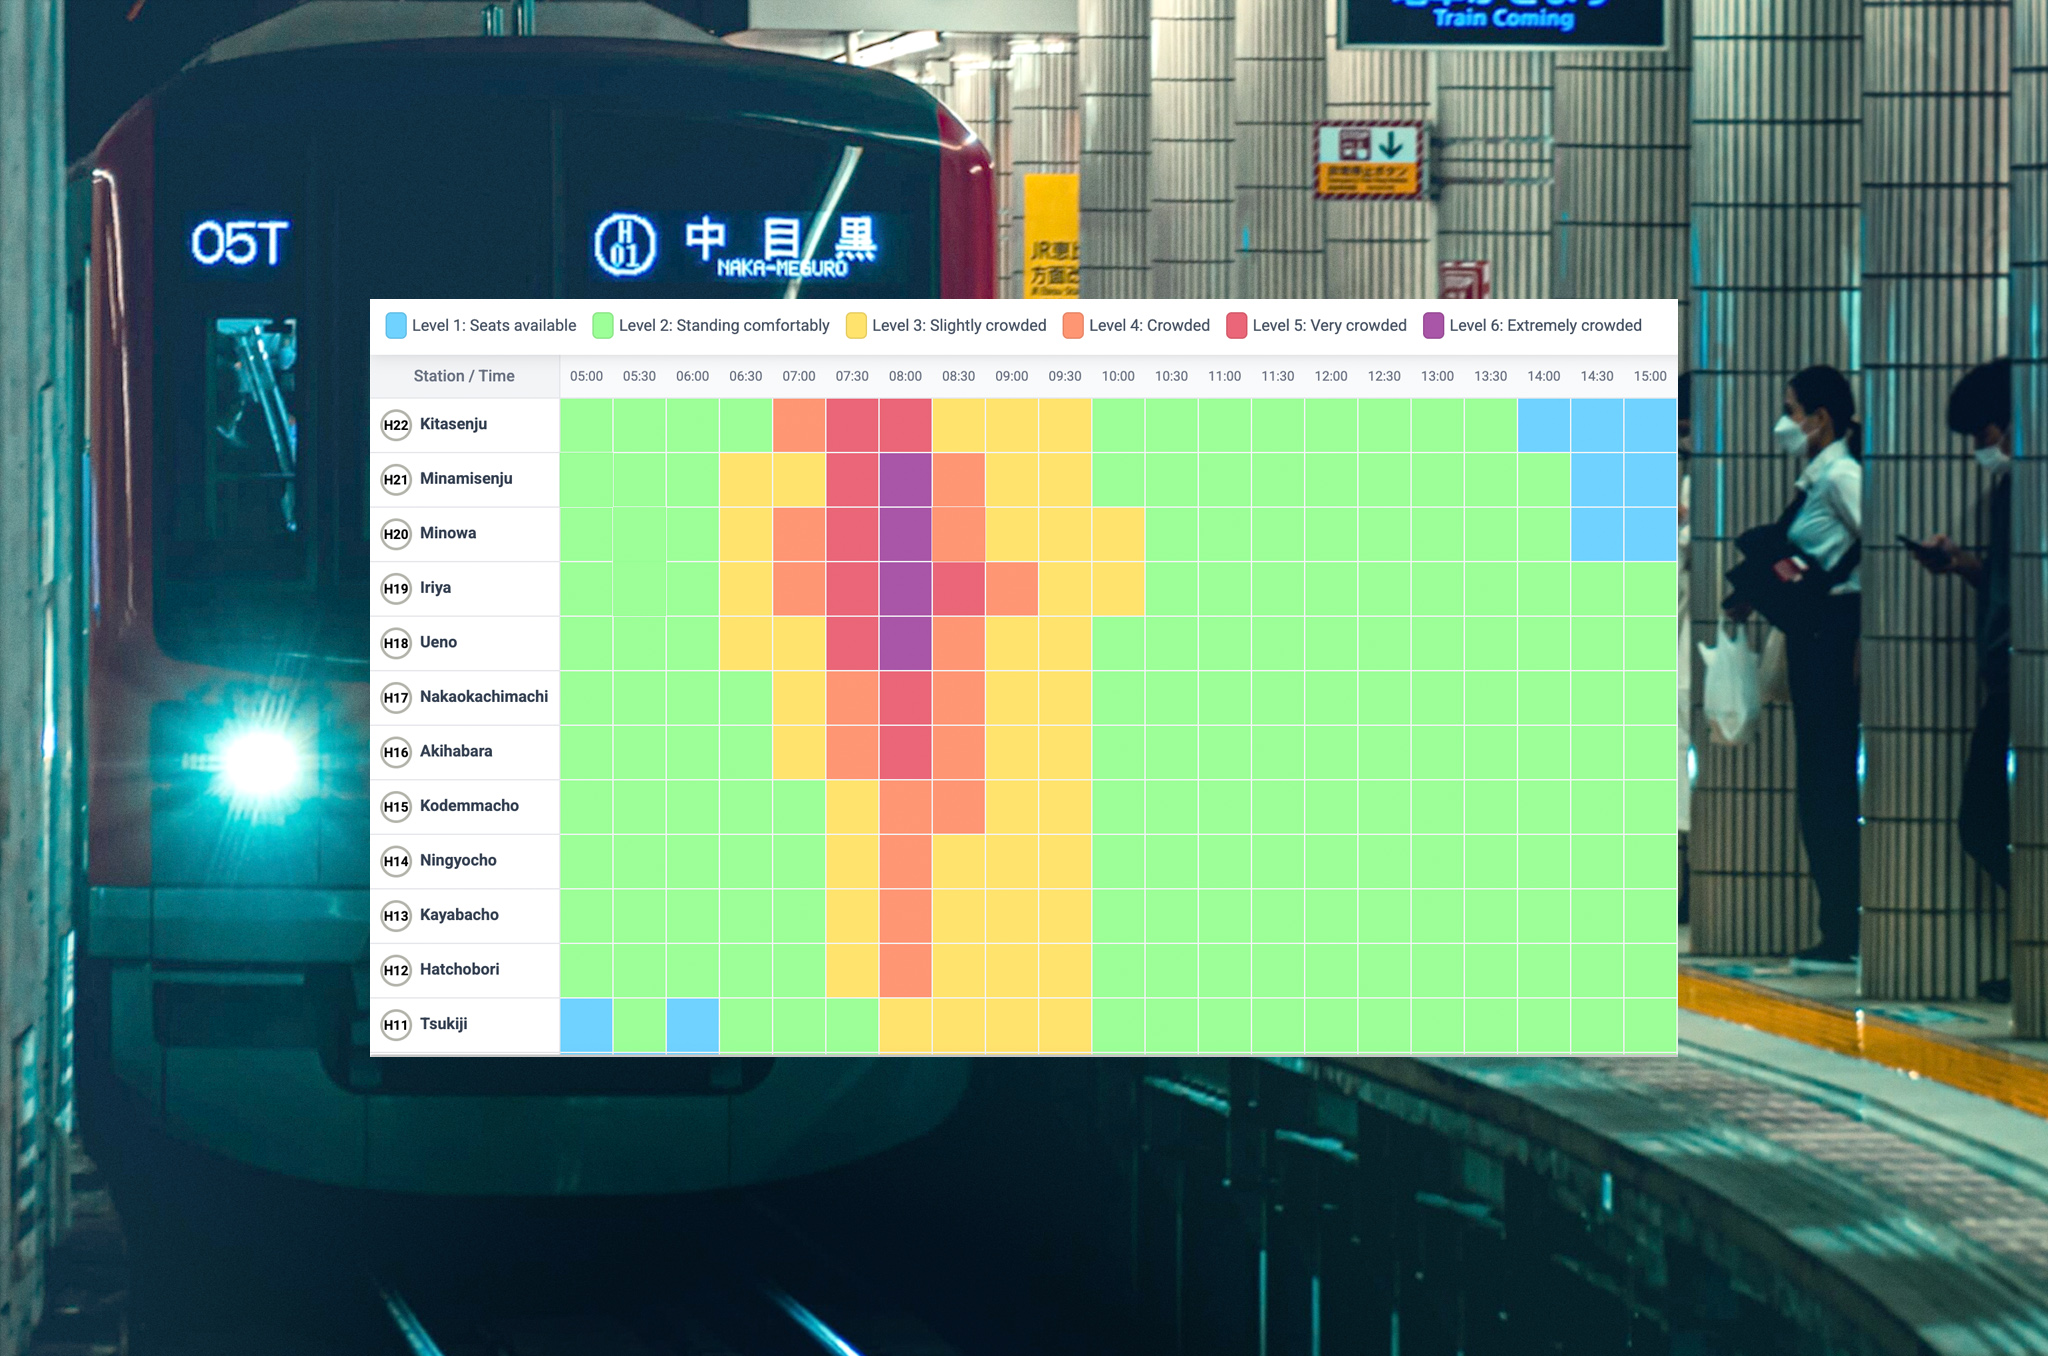
Data showing crowding on the Hibiya Line | Screenshot via the Metro CrowdNavi website
Tokyo Metro Expands Digital Tools for Passengers
The launch builds on Tokyo Metro’s broader push to provide passengers with digital travel tools. In recent years, the operator has expanded its mobile services through the Tokyo Metro my! app, which calculates routes that combine trains, taxis, local buses and shared bicycles. The app also provides detailed walking directions and guidance within complex station buildings, while offering real-time train location data and operational delay information to help passengers navigate the network more efficiently.
Tokyo Metro later added carriage congestion information to the app and station display monitors. The feature uses a four-level color-coded scale to indicate crowding levels on approaching trains: blue for available seats, green for no empty seats but relatively light passenger loads, orange for standing-room-only conditions and red for heavily crowded carriages. Metro CrowdNavi expands access to congestion data beyond individual trains. The website provides a broader view of crowding trends across the network.